Tuesday, July 31, 2012

12:30PM Quick Technical Analysis Update


Portfolio Update:
Entries:
SPXU @ 43.8
AAPL August 20, 600 Strike Puts @ 9.2
SPY Sept Quarterly 125 Strike Puts @ 0.91

  • SPXU shares scaled in yesterday at 43.8, will scale in the last half if >=45 in the next few sessions or <=43.8 again. Note, this is a very high probability and a high confidence trade based on overbought levels and MAJOR resistances)

  • AAPL scaled  in Monthly August 20 600 puts (Note, this trade has  a lower probability trade compared to the previous August 3 weekly 580 calls) 

  •  SPY puts were bought last Friday as discussed in skype group

Definition, scale in means 1/3 or 1/2 of the position planned to execute, therefore if you want 10 puts altogether, first scale in should be 3 or 5 contracts.
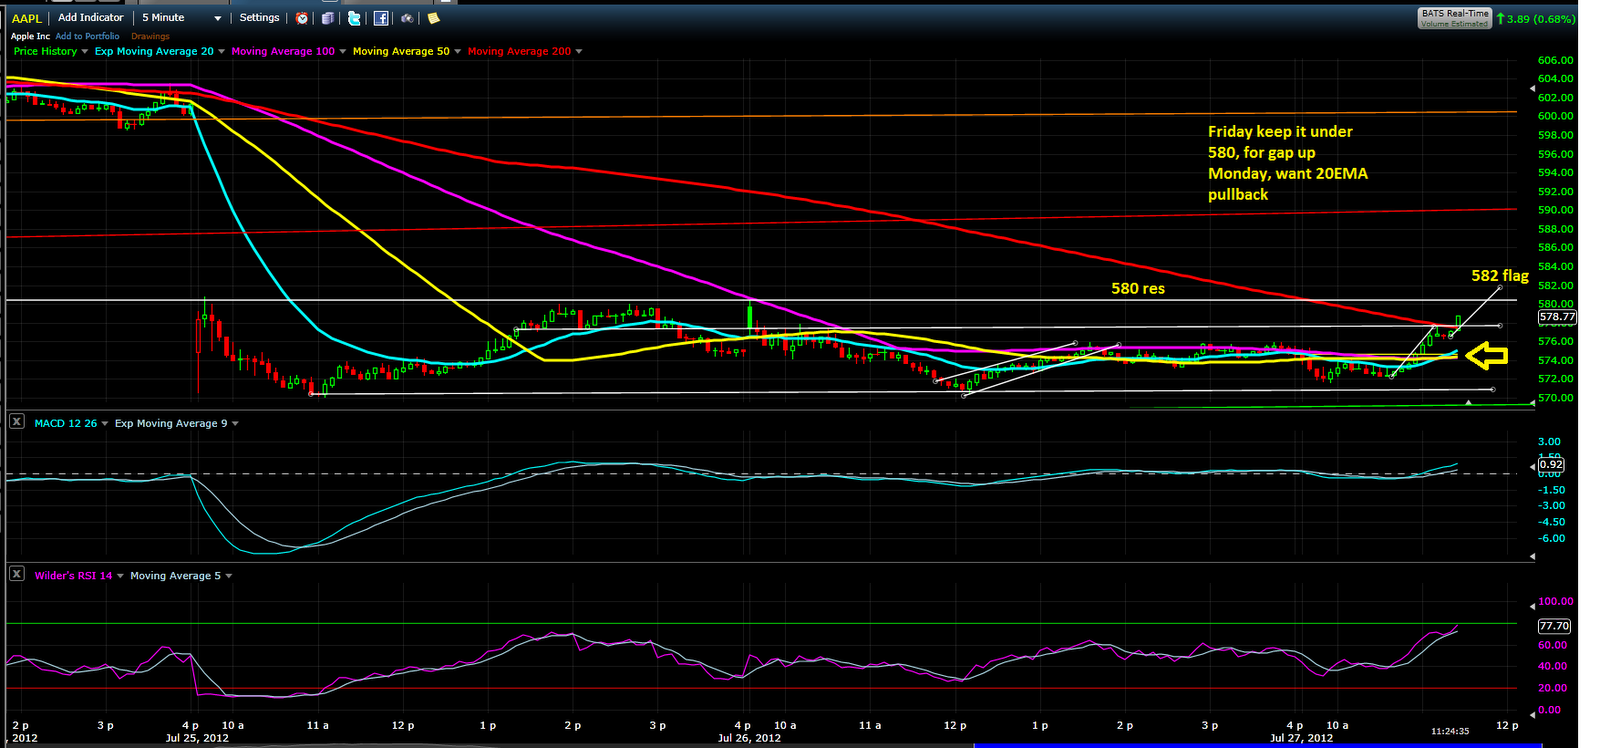

AAPL

AAPL is slightly overbought right now on 60min at roughly 70rsi using RSI-14 settings, not extreme yet. 


SPX/SPY


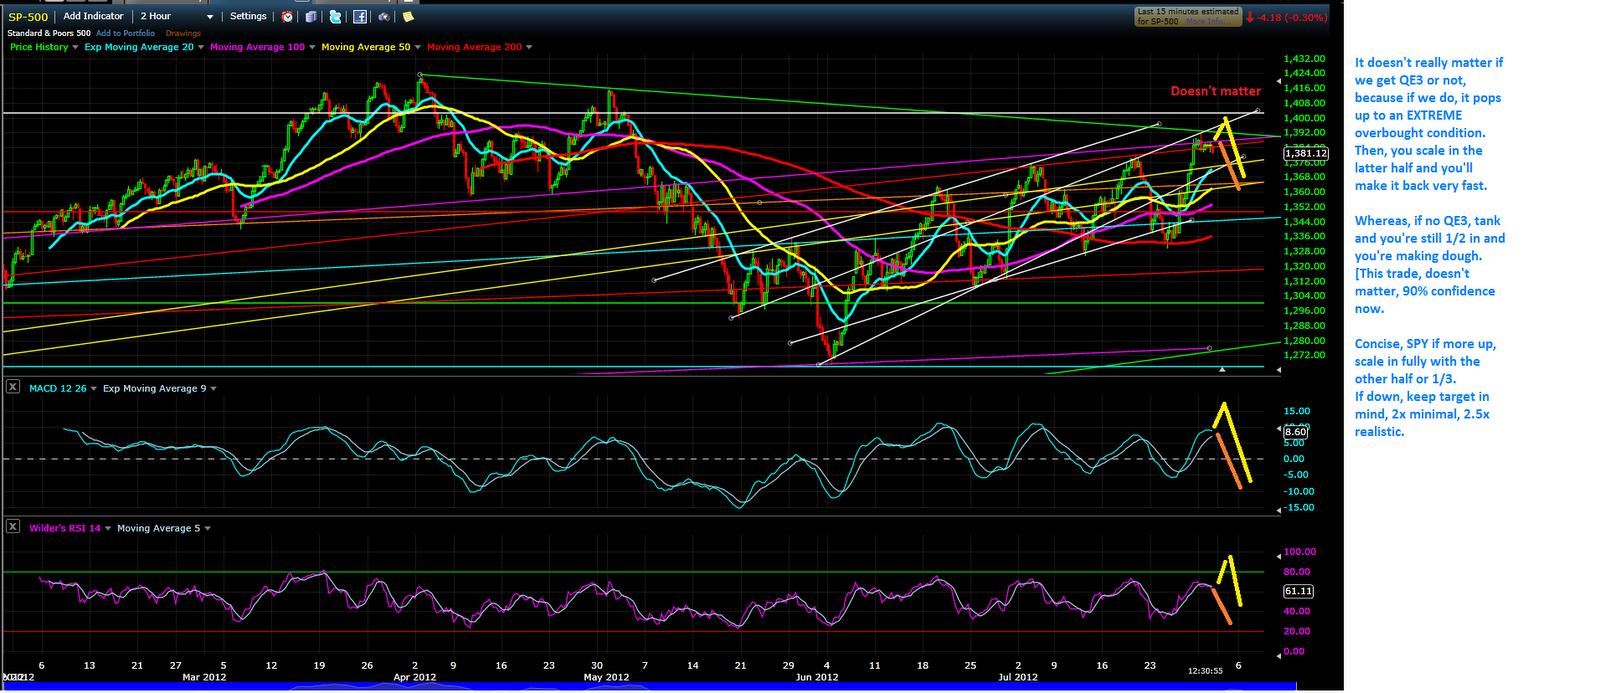
 It doesn't really matter if we get QE3 or not, because if we do, it pops up to an EXTREME overbought condition. Then, you scale in the latter half and you'll make it back very fast.Whereas, if no QE3, tank and you're still 1/2 in and you're making dough.This trade is 90% now. Concise, SPY if more up, scale in fully with the other half or 1/3.
If down, keep target in mind, 2x minimal, 2.5x internal target.

SPXU


SPXU above 45 would be a buy confirmation signal, it also is the 60min 20EMA spot.
<43.8 to scale in>45 for confirmation, if you want.
>45= we are going to 50 most likely.

-Red Apple

Monday, July 30, 2012

9:43AM Another Too Fast Too Furious


Trade update:

AAPL Aug 3 580 calls sold at 12 bucks so slightly over a double 12/5.5


AAPL is approaching too fast too furious levels


-Red Apple

9:25AM Trade Update

Selling the AAPL Aug 3 580 calls for a double at open

Keep watch on SPY, may scale in SPXU these 2 days.

-Red Apple

Sunday, July 29, 2012

6:10PM, AAPL Weekly Chart

(Green Apple) Until proven otherwise: downwave in an intermediate-term downtrend/consolidation period. 

I've started a position in SEP'12 560/570 bear put spreads (long 570, short 560).  My current thinking, subject to changing market conditions: should we take out 588 and attempt to fill the pre-earnings gap @ 598, I'll continue scaling in, adding every 5-10 points.  Then, on the road down, I'll take profits on bear spreads (scale out) as I open new bull spreads (scale in).

AAPL Weekly Chart - as of 07/29/12

Friday, July 27, 2012

1PM AAPL + SPX Technical Analysis

 Red Apple's AAPL Update
Scaling in on an oversold stock

August 3, 580 calls @ 5.5

Playing the oversold AAPL bounce 
This is a 80% trade. (90% if we hit 555-565 zone along with hourly rsi under 25)
Would be a dream come true if we gap down on Monday to fully scale in, but at this moment it looks like a gap up and go instead.
(Most of the time I only play weekly options and common stock) 


 SPX Update

 We are approaching a MAJOR resistance on SPX


-Red Apple

Wednesday, July 25, 2012

10:55PM AAPL Technical Analysis

                            (Red Apple) 555-565 is the temporary buy the dip zone based on support and oversold conditions. Anything higher than 565, then it is not worth the risk vs reward in this short term environment. Short until 555.00 *


What we know now. 600 is an established top floor and most likely we will not re-take it for at least 20 trading days, 555 is super major and also the bull-bear zone from a 3+ year support/channel line. With 565 as the upper one and 555 as the bottom.

AAPL is also hugging the lower bollinger band, and we will likely expand lower for the rest of this week. I suspect the relief + oversold rebound will initiate on Monday July 30.

*Condition: If AAPL closes above 581 tomorrow then the plan to 555-565 support area becomes invalid.

-Red Apple

Wednesday, July 18, 2012

4:50PM, Bullish Divergence

(Green Apple)  Of course, with monthly OE this Friday, anything can happen. That said, we do have bullish divergence on the 30-minute chart.

AAPL - 30 minute chart as of 07/18/12

Tuesday, July 17, 2012

10:46PM AAPL Technical Analysis

(Red Apple) The AAPL target of 619-620 has failed and is invalid now. AAPL is now within a small downtrend channel and the 603-604 horizontal support held so far. The 100% measure move of 615 still has chances, but it is definitely not a high probability trade due to rejection on resistance and slight downtrend channel. We're in wait in see mode. Can't long or short because we're below yellow resistance line and above 603 support.
See charts below.


Price action has been sideways for the last 2 days and it is monthly option expiration week. Based on the past few incidents of monthly OE for AAPL, Wednesdays are typically larger in terms of price action and/or it sets a new trend. See chart below


(Dotted teal lines are the Wednesdays on monthly options expiration week, and solid red lines are the Fridays)


-Red Apple

Monday, July 16, 2012

AAPL Technical Analysis Update


AAPL technical analysis

So far so good, but a boring Monday.

Maintain same target, revised safety net/stop-loss.

619-620 Target, 603-604 stop-loss.


-Red Apple

Saturday, July 14, 2012

8:23PM Maintaining Target + Safety net


(Red Apple) I'm back, apologize for not posting here lately, I will try my best to post more frequently.

Maintain the target that I discussed in the skype group and added a safety net

619-620 Target by Tuesday, July 17th 4PM. I have stop loss at 597.5-598 if anything goes wrong


This is not a 90% chance trade like the May 18 bottom I called earlier

-Red Apple

Friday, July 13, 2012

7:50AM, ANY time now . . .

(Green Apple)  Zooming out to a slightly larger view, note we have hit key Fibonacci retracement levels with machine-like precision.

AAPL Daily Chart as of 07-13-12

Sunday, July 8, 2012

1:20PM, More Retrace?

(Green Apple)  Let's see what happens Monday. . .

AAPL Daily Chart as of 07-08-12

Sunday, July 1, 2012

12:30PM, 606th Floor Please!

(Green Apple) Remember the cartoon with Droopy Dog: "Going UP, sir."

AAPL Daily Chart as of 07-01-12