Thursday, February 28, 2013

AAPL + Dow Jones Technical Analysis

AAPL - There was no price continuation for bulls, so we resumed the bearish channel. Odds still favour bears for intermediate term.


Dow Jones leading indicator this week and it formed a megaphone pattern. It would be very very bullish if it holds the 14025 line because the sheer size of this up leg was larger than the down leg. Which means if market continues to stay above major supports, higher highs are expected.


Wednesday, February 27, 2013

AAPL + DJI, SPX, ES Technical Analysis

AAPL - Watch for key resistance of $455, to determine whether this hourly bullish divergence bounce is real or not. If no bull continuation tomorrow, then resume bear channel. See charts:


Yesterday, we said that the Dow Jones is a leading indicator this week so we kept a close eye on it. It validated itself in real time when we watched the intraday bottom formation that had a bullish divergence signal with price confirmation.

Intraday signal charts:


 ES pattern target:


Tuesday, February 26, 2013

AAPL + DJI, SPX, ES Technical Analysis

AAPL - The bounce couldn't take out $466, so the short entry set up is here as we broke below the $445 support. It is key time for bears to see if we could break below the grey trend line or not (the one where we formed a temporary bottom at $435- the maximum overshoot line).


Market Next Major Supports:
Dow Jones 13660
SPX 1473
ES 1468

Signals from Friday's close had its limitations, trust price only. Stay nimble


Monday, February 25, 2013

AAPL + SPX + Dow Jones

AAPL - Bouncing a little bit as expected, but this week is key time for bears. If the bounce cannot take out the $466-465 area of resistance during this week, then we are gearing towards a short entry set up. The resistance is where the descending channel line from 705 meets the $466 horizontal resistance line.


SPX + Dow Jones looks like whipsaw movements for the first two days of this week


Friday, February 22, 2013

AAPL + S&P Futures

AAPL: It is still in an intermediate bear trend, 78.6% retracement finally hit and that renders the rebound from 435 to 484.94 as a dead cat bounce. Stay nimble, might be setting up for a mid term short trade. See charts:


S&P Futures: Possible rebound target, might be an okay risk vs reward trade using a tight stop at 1503.25. The higher probability trade would be to enter short at either 61.8% or 50% for the second leg down. Stay nimble


Thursday, February 21, 2013

AAPL + S&P Futures

AAPL: Bulls' Final Stand was broken intraday and we're gunning for the 78.6% fibonacci retracement now. The Hourly RSI is close to becoming an extreme oversold signal, which means a quick trade on an intraday bounce. Overall, this chart is in a bearish intermediate term now. Stay nimble. See charts:


S&P Futures:
Extreme oversold signal, rebound first, then wait and see.


Wednesday, February 20, 2013

AAPL + SPY + S&P Futures Technical Analysis

AAPL: Bounced at the 61.8% fibonacci retracement and trending support line. Now, bulls must show conviction by regaining $465-466 on Feb 20. Will update the second leg potential (485+) when we get the price confirmation. Stay nimble. See charts:


SPY:  Still the same bullish chart, however the daily RSI is becoming overbought again and negative divergence on hourly SPY. Will go for a scalp buy at ~$152.56 if a healthy pullback occurs. See charts:


ES: Hourly overbought signal


Tuesday, February 19, 2013

AAPL + SPY Technical Analysis

AAPL: I've waited a week for this setup, these two days will be the moments of truth (Feb 19+20), as it will determine whether we're going for the second leg up (485+) or the retest of the bottom. Stay nimble. See charts:


SPY: The chart is still bullish even though bears had made some progress on Feb 15. Overall, AAPL is still easier and more profitable to trade than SPY at the moment.


Friday, February 15, 2013

AAPL + SPY Technical Analysis

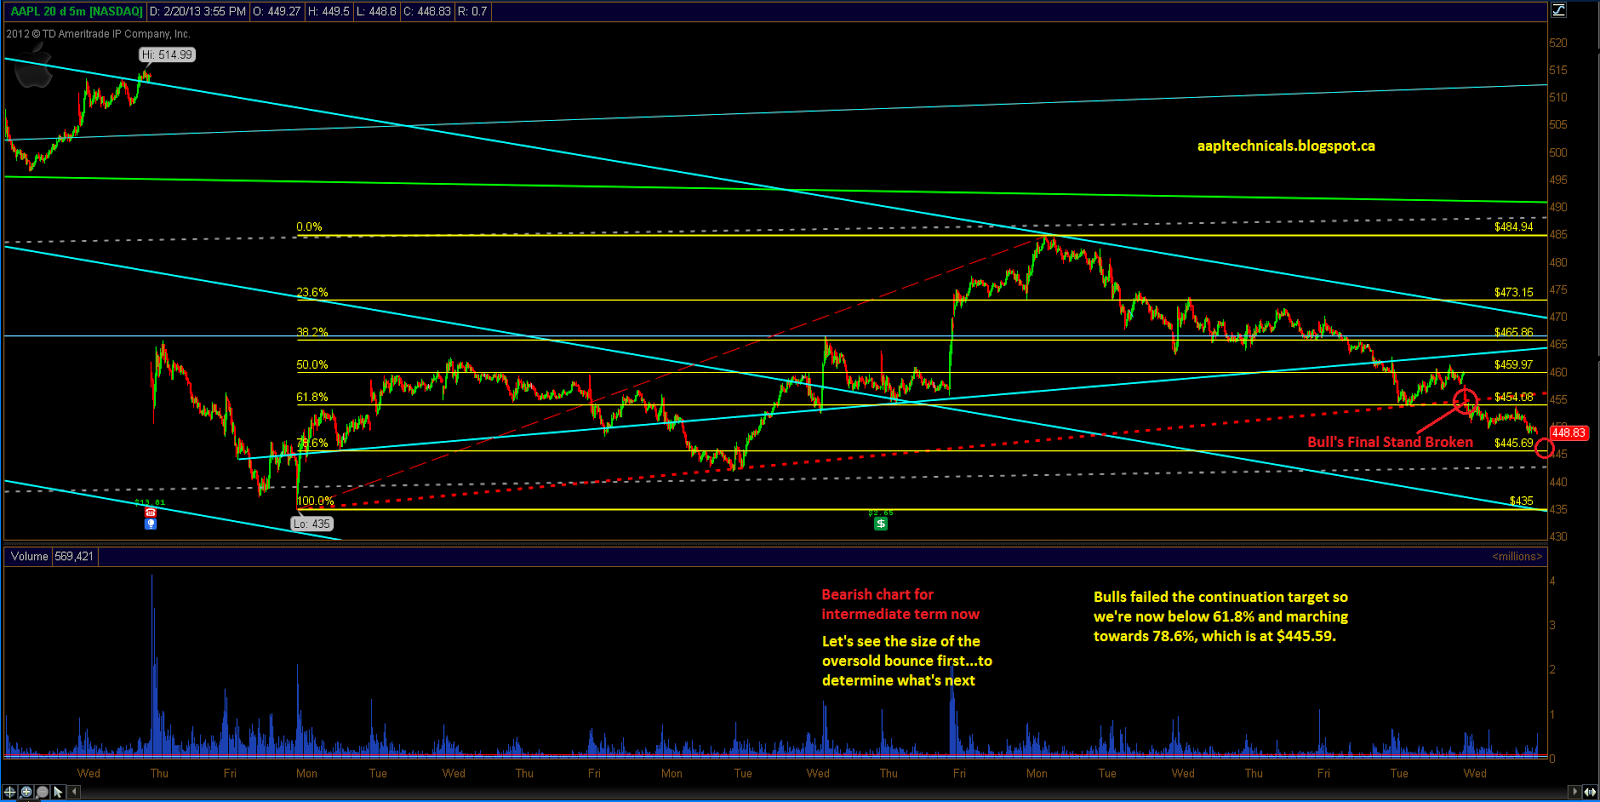
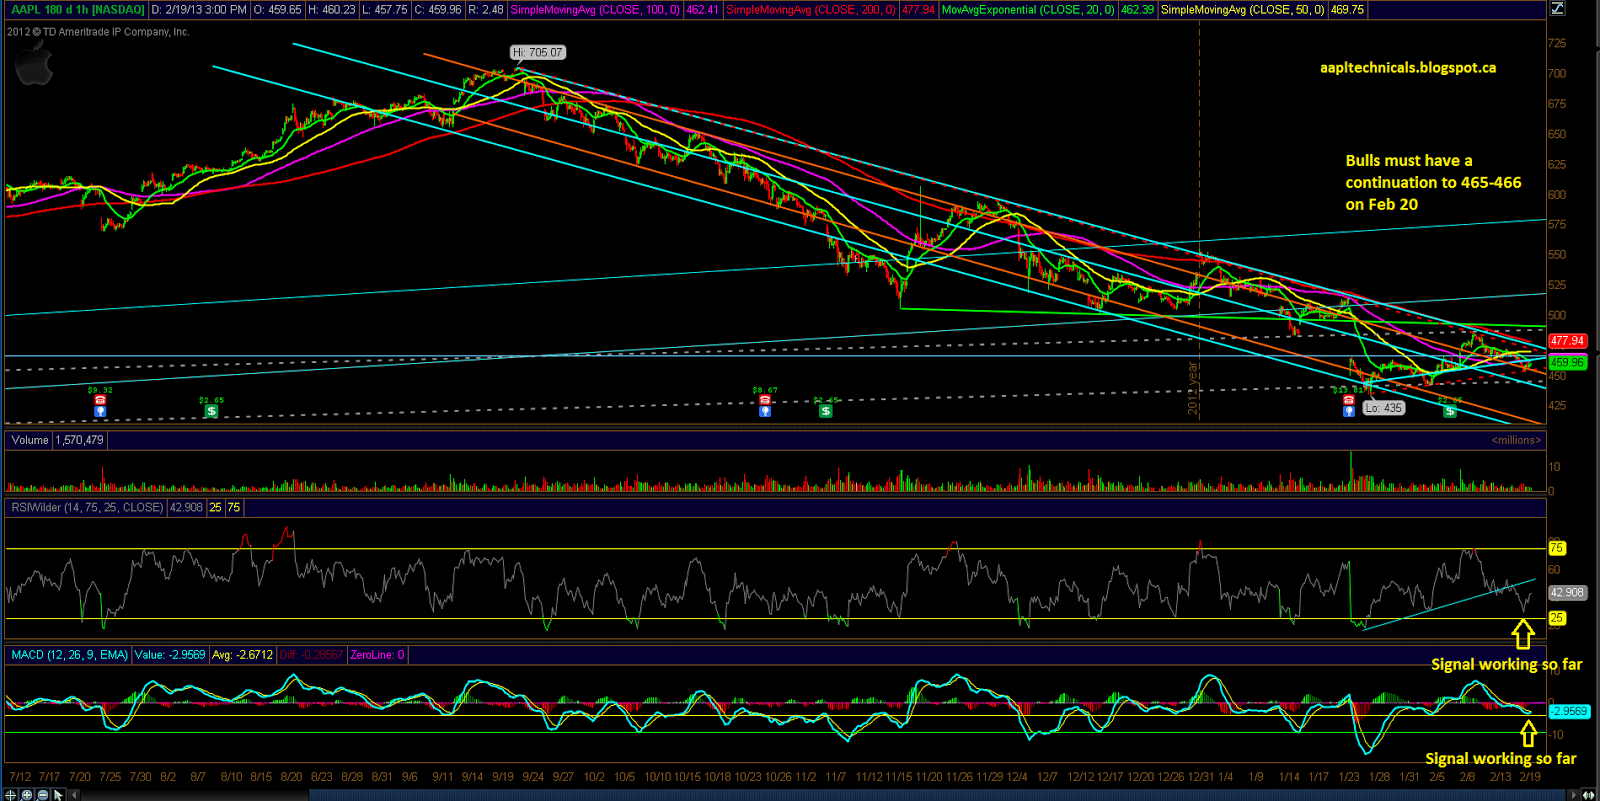
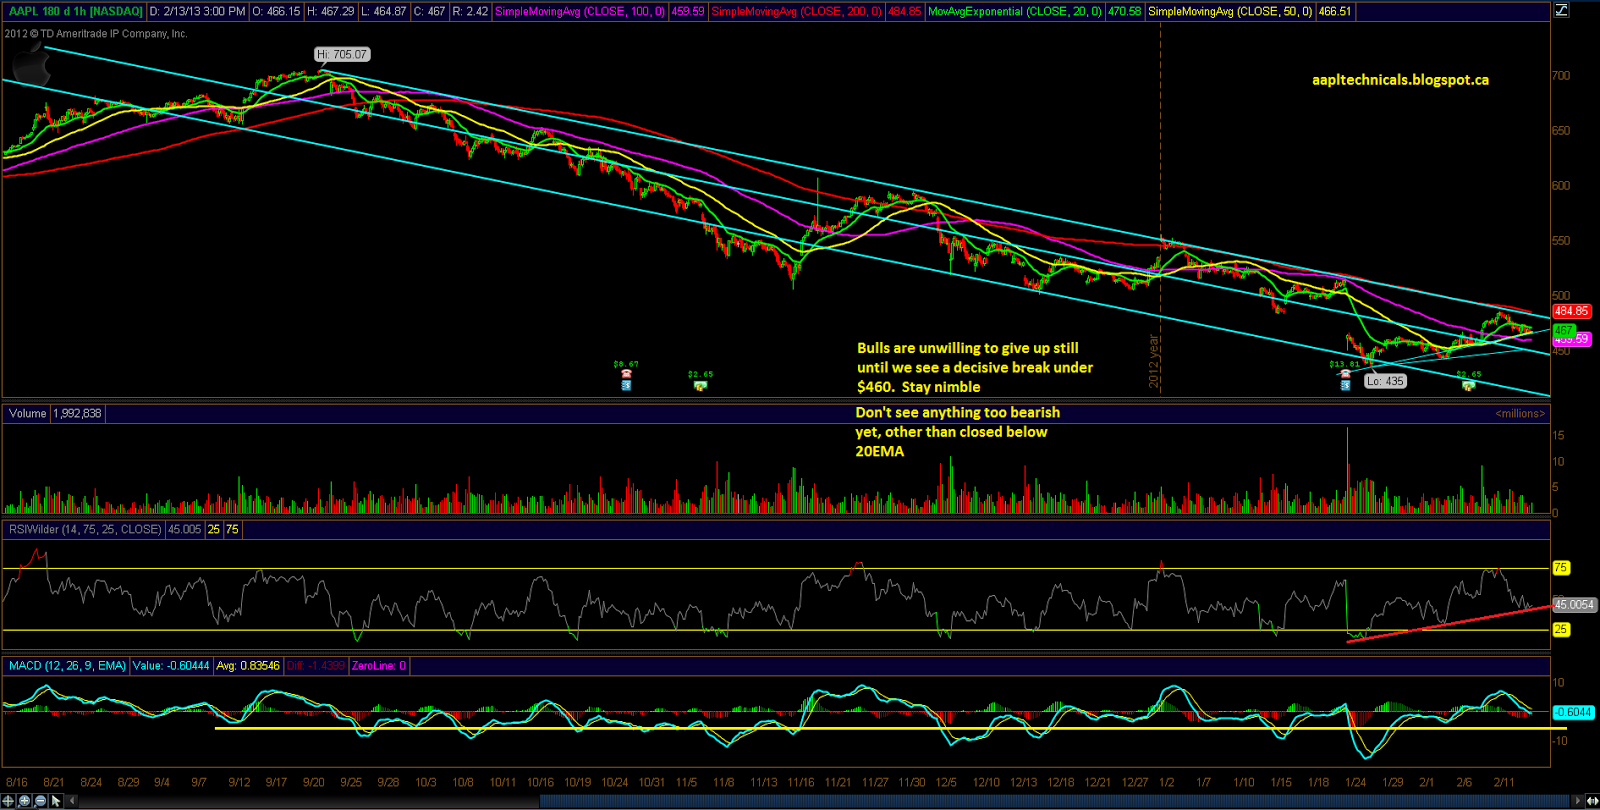
AAPL - We had a classic limited range day just like anticipated, Apple still relatively easy to trade intraday when compared to SPY. Lets cut to the chase, the next 3 trading days is very important for the bulls (Feb 15, 18 and 19). As long as Friday's closing price is not decisively  below $460, then on Feb 18 the bulls would have a high chance of a run up. However, in order to have a final confirmation of a LARGE leg(higher high to 500+), this must be followed by a Tuesday continuation run. Typically, Fridays are continuations of the week's current pattern and Monday is a new trend/direction with Tuesday being the final confirmation day. Same limited range as yesterday for Feb 15, $460-475. Stay nimble. See charts:

EDIT 9:00AM EST: Oops, Feb 18 president's day, so Feb 19+ 20 are the important days for bulls :)


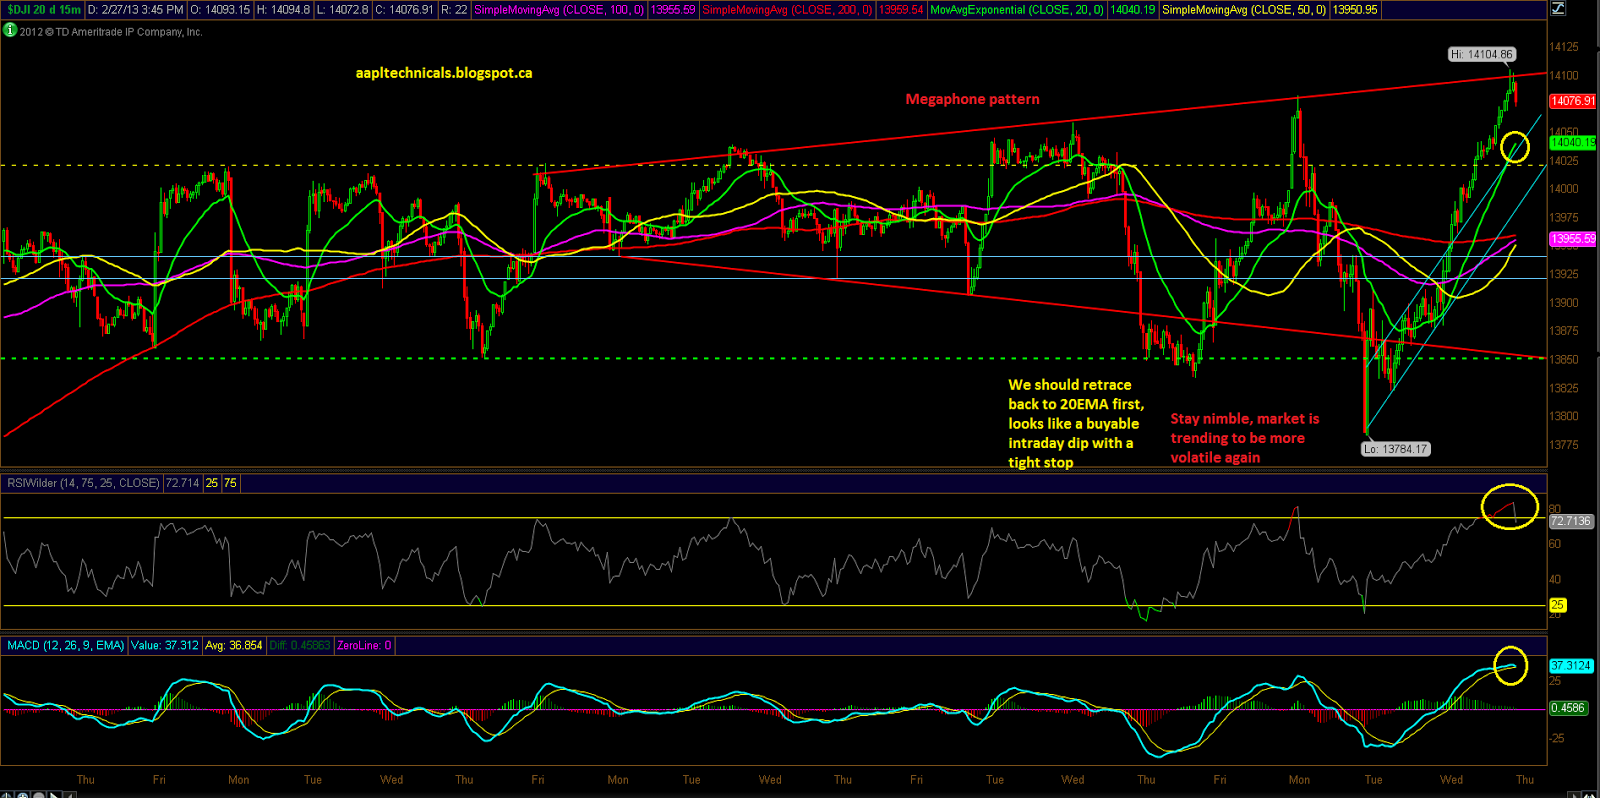
SPY - Bullish pattern intact


Thursday, February 14, 2013

AAPL + SPY Technical Analysis

AAPL - Same thesis from last night, chart still looks good for bulls. As long as we hold $460-465, bulls still have another shot with the next leg up. Just don't forget to jump ship if we do decisively break below. Until then, I don't see any true bear sightings. Also, tomorrow may have a limited range of $460-475. If AAPL gaps down in the morning to near $460 with 5-minute chart RSI and MACD at extreme oversold settings, then I will buy the dip again just like Feb 13. See charts:


SPY - Guess what, same thesis again. Bullish pattern still.


Wednesday, February 13, 2013

AAPL + SPY Technical Review

AAPL - Last night, we expected a pullback to $473 and saying that it is imperative for 473 to hold, but the figure could be adjusted to 465 if new signals arise. Well, we have the signals, and the absolute must hold figure has been adjusted to $460. Anything lower would yield a very low probability for the next up wave. Holding $465, would yield a higher probability than $460 based on relative strength. See charts:


SPY - Same thing again, bullish pattern still with a scalp short signal added.